open-payments-white-space
What Open Payments Actually Measures
Jacob Lee · August 2026
I set out to answer a question the pharmaceutical commercial data industry is built on and nobody had measured: which American physicians has the industry never reached?
Open Payments is the federal record of every payment from drug and device manufacturers to US physicians, covering meals, consulting fees, speaking honoraria, travel, and research. It has been public since 2013 and is heavily used. Nearly every study asks the same thing: does taking industry money change what a doctor prescribes? The physicians who take money are the subject. The ones who don’t are the control group.
In one widely cited 2016 linkage, 379,035 prescribers were set aside in a single clause, “presumed to have received no payments,” and never mentioned again.
The question turned out to have a smaller answer than expected, and a more interesting one underneath it.
The white space is real, and mostly not worth having
Linking Medicare Part D prescribing to the complete Open Payments record: 146,459 of 696,647 MD/DO Part D prescribers, or 21.02%, have never received a reported industry payment. Cumulative, every program year since 2013.
The commercially interesting subset should be the high-volume ones: physicians writing a lot of prescriptions whom nobody has ever contacted. There are 17,108 of them in the top two prescribing-volume deciles, writing 97.9 million claims worth $8.21 billion.
That number does not survive contact with the obvious objection. Only 553 of those 17,108 also prescribe at high cost per claim. The other 96.8% are high-volume, low-cost prescribers: family medicine and internal medicine writing enormous quantities of cheap generics.
That is exactly what a selection story predicts. Industry did not overlook these physicians. Industry evaluated them and declined.
The selection-robust group, meaning high volume and high cost per claim and never engaged, is 553 physicians accounting for $924 million in Part D spend. Depending on where you set the threshold, 553 to 3,896 physicians and $0.9 to $3.0 billion. No cut point is principled, so the range is the honest answer.
That is a real population. It is also 94% smaller than the headline number, and finding that out required deliberately attacking my own result.
Why the white space is so small
Because “engaged” turns out to be an extraordinarily low bar.
58.7% of engaged physicians have food-and-beverage payments and nothing else. No consulting, no speaking, no research. The median engaged physician has 16 payment records totalling $705 across five years, about $141 a year.
Open Payments does not primarily measure financial relationships between physicians and industry. It measures lunch.
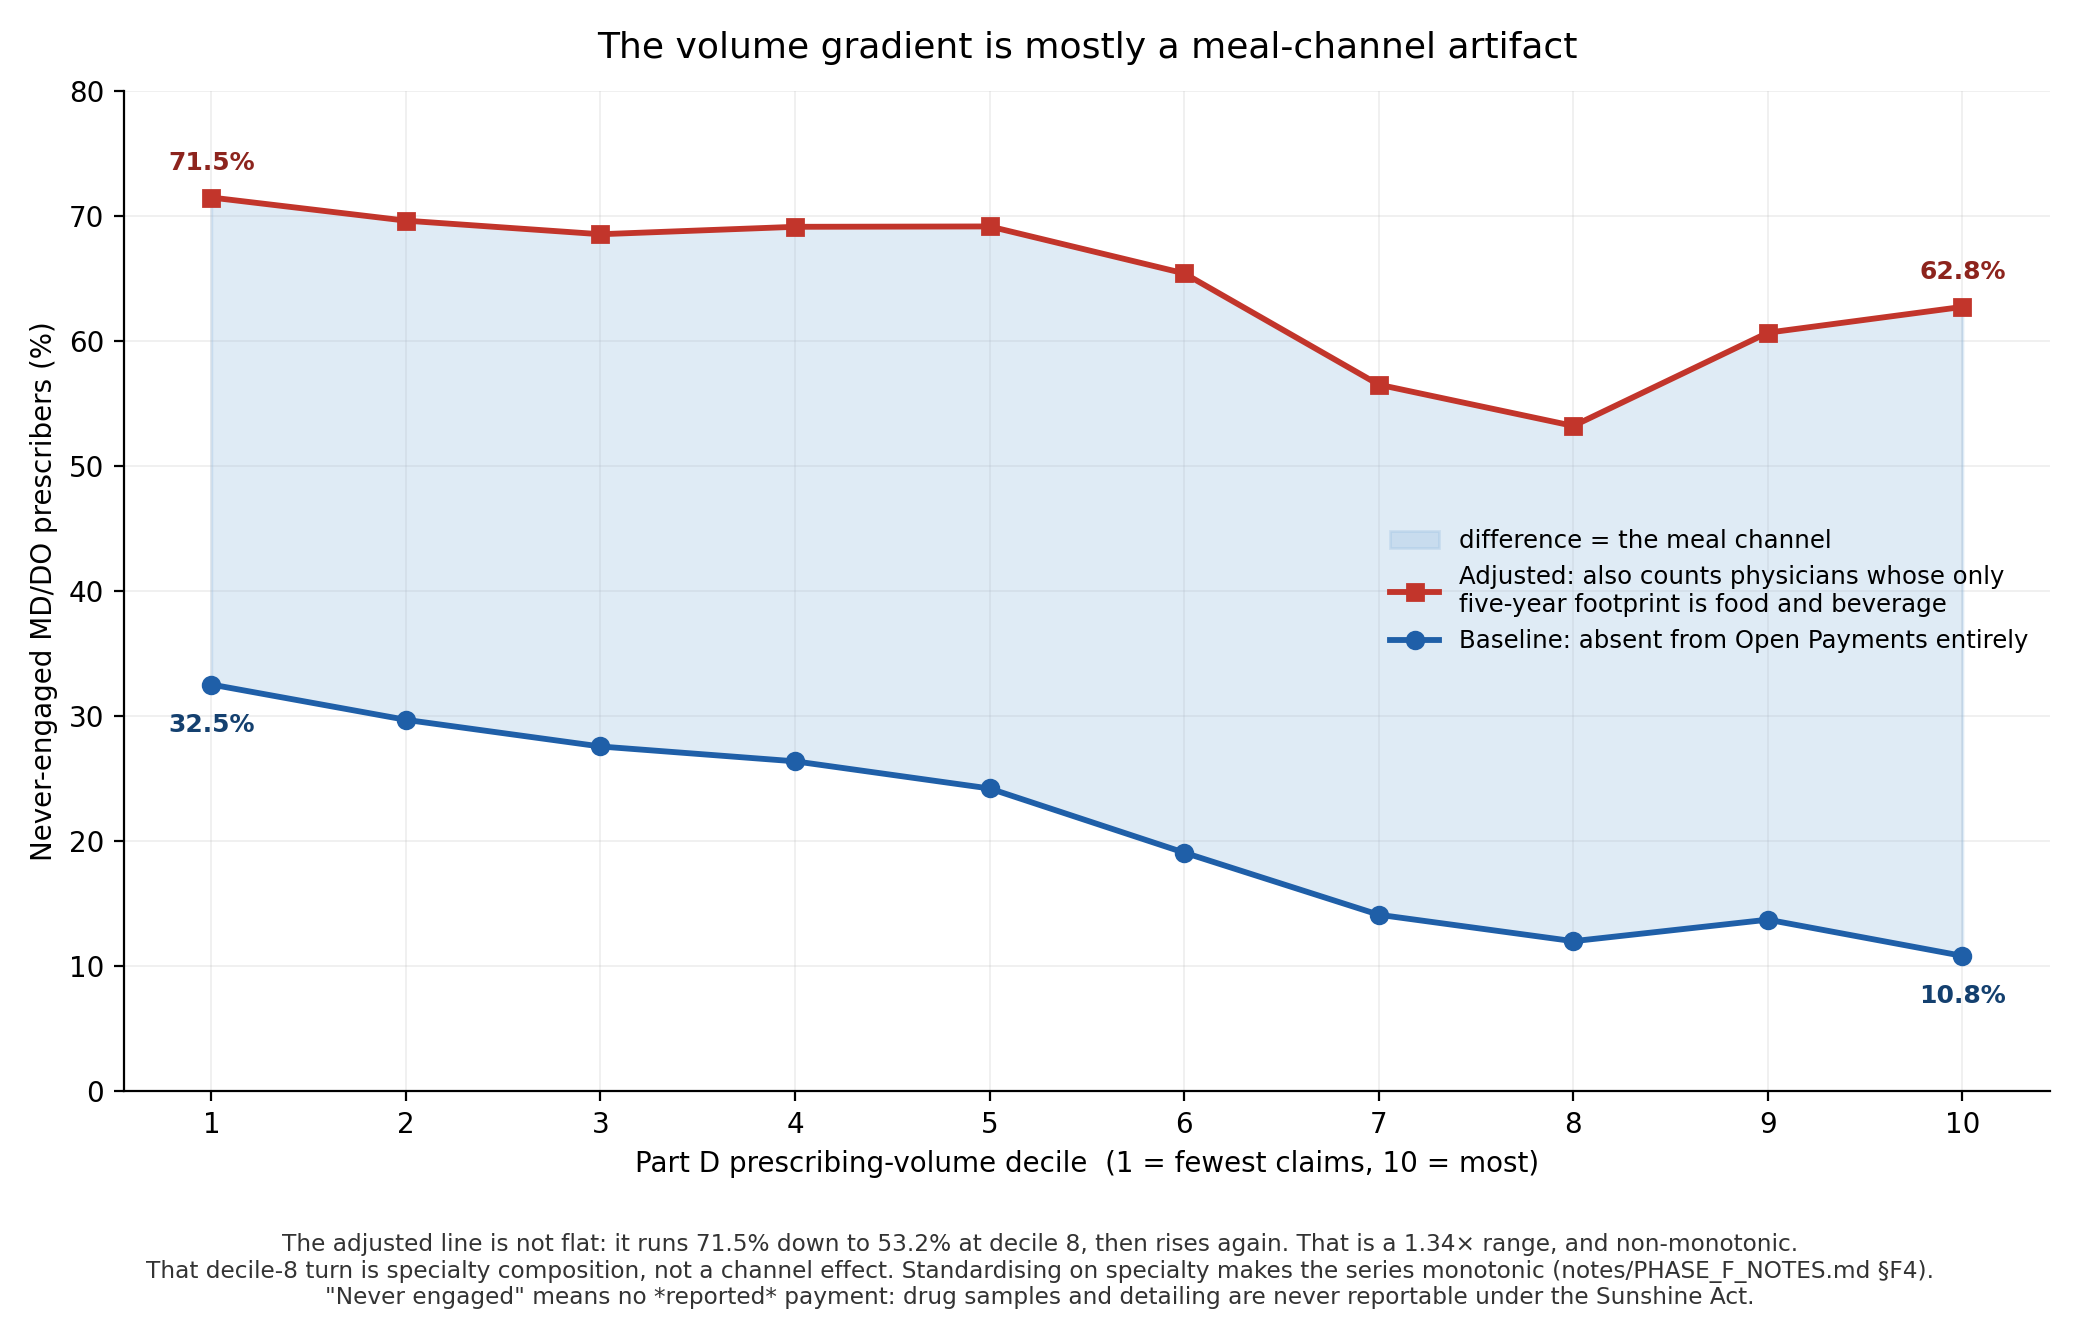
This has a consequence nobody seems to have followed through. Meals are legally variable in a way that consulting agreements are not. Vermont’s 2009 gift ban prohibits most gifts to providers, including food. Minnesota, Maine, Massachusetts and others have restriction or disclosure regimes of varying strength.
So the state pattern in the raw data, a spread of 8.4x between the highest and lowest states, is substantially a legal artifact. Reclassifying meal-only physicians as non-engaged compresses that spread to 1.30x.
But not to nothing, and this is where an earlier version of my analysis was wrong. Running the same test on a single program year, the state rank ordering collapsed entirely (Spearman ρ = 0.121) and Mississippi moved from lowest never-engagement in the country to nearly the highest. On five years, the ordering holds (ρ = 0.845) and Mississippi sits at rank 40 of 52, near where it started.
The one-year result was an artifact of its own. Non-meal relationships are episodic. A consultant paid every other year looks meal-only in the off years. Any single-program-year channel analysis systematically over-classifies physicians as meal-only, by roughly 16 percentage points in my data.
The corrected claim is narrower and better: cross-state differences in measured engagement are real, but the raw database overstates their magnitude roughly sixfold, and the inflation runs through a single legally variable channel.
Two situations, identical data
Consider two physicians with no food-and-beverage payments.
One practises in Vermont. A representative may legally detail her, meaning explain a drug, answer questions, leave literature. What the representative may not do is buy her lunch. The relationship exists; the reportable transfer does not.
The other works for Kaiser Permanente, which states publicly that it does not permit pharmaceutical sales representatives into its hospitals and medical offices, relying instead on internal pharmacy staff. There is no relationship to record.
Open Payments cannot tell them apart. Both are zeros.
But it can if you use two axes instead of one. Classify every physician on food-and-beverage payments and non-food payments separately, and the two situations separate:
- Vermont. 6.42% of physicians have a professional relationship with no recorded meal, against 0.15% in Mississippi. Forty-three times as many.
- Kaiser. Non-food reach of 5.6% to 13.5% against a 30.71% national rate, in all eight entities, across seven states including low-restriction Georgia and Hawaii.
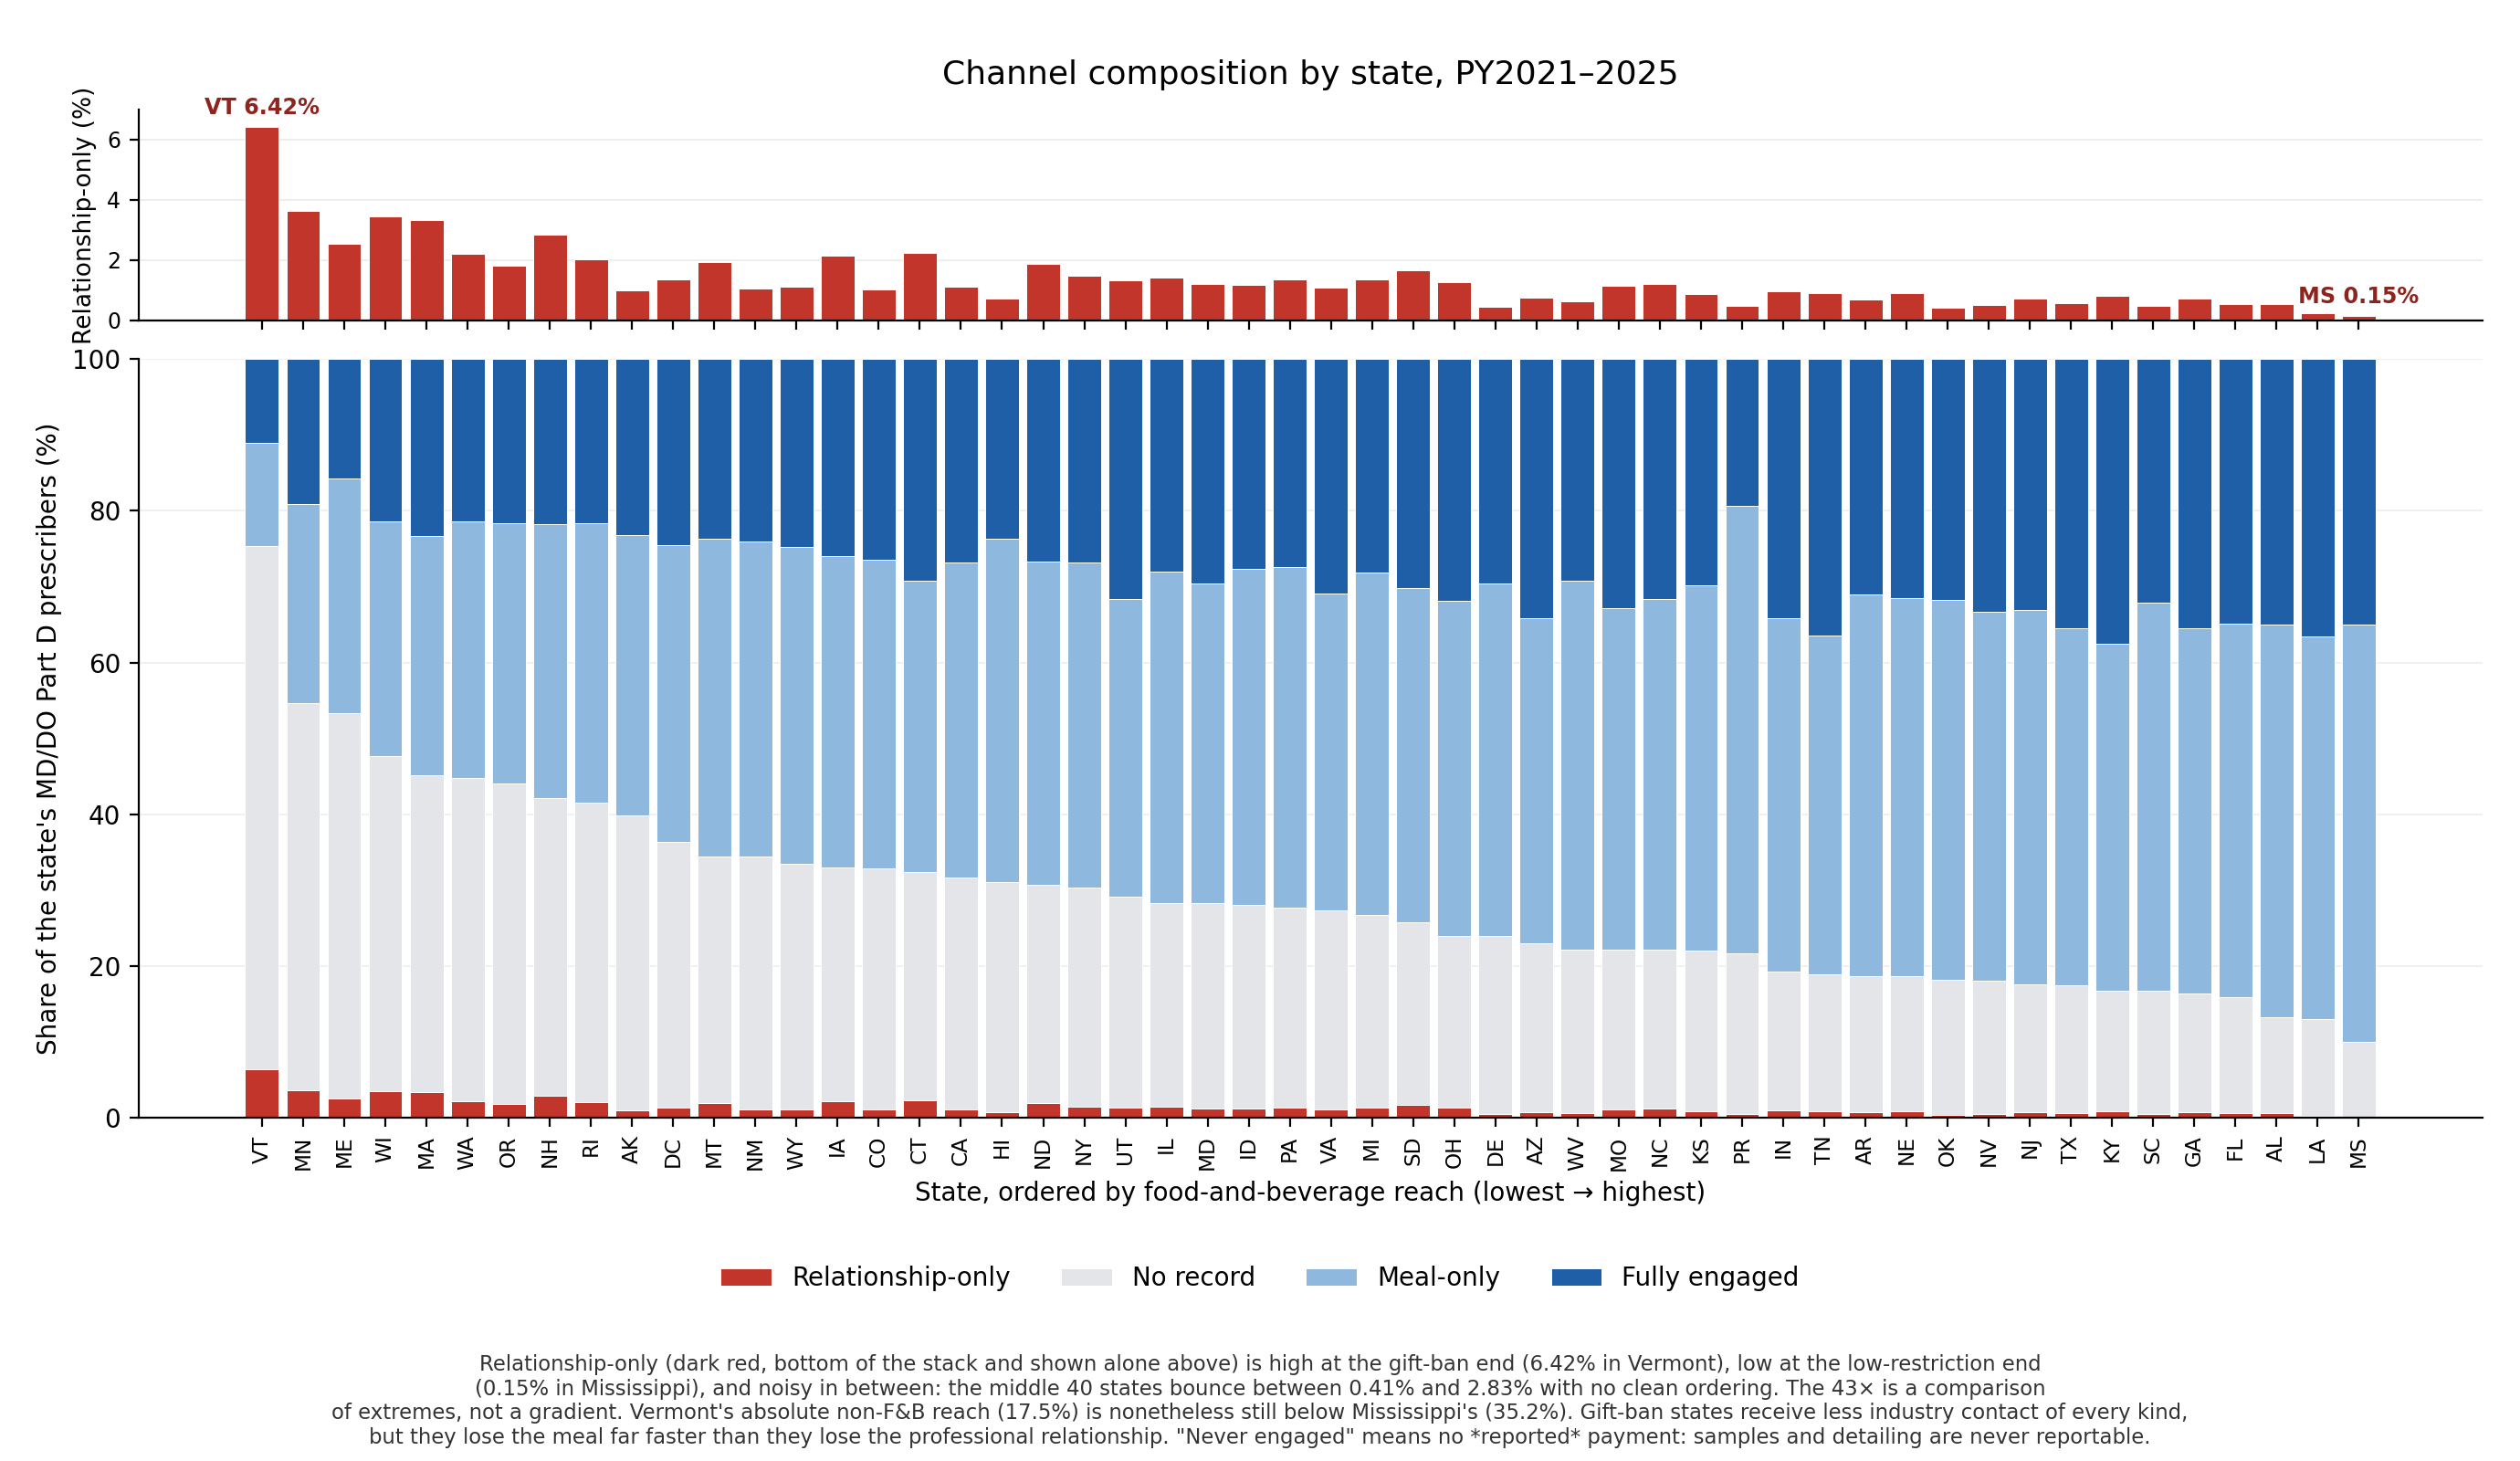
One channel is suppressed in Vermont. Both are suppressed at Kaiser.
Testing it blind
A measure demonstrated on two groups you chose in advance proves very little. It needed an external standard.
Larkin and colleagues (JAMA, 2017) identified 19 academic medical centers that adopted policies restricting pharmaceutical detailing between 2006 and 2012, coded by policy content. Different researchers, different purpose, labels fixed years before this data existed.
Scored against that set with no tuning:
| Median | Range | |
|---|---|---|
| 18 academic medical centers | 1.110 | 0.932 to 1.360 |
| 8 Kaiser entities | 0.727 | 0.557 to 0.794 |
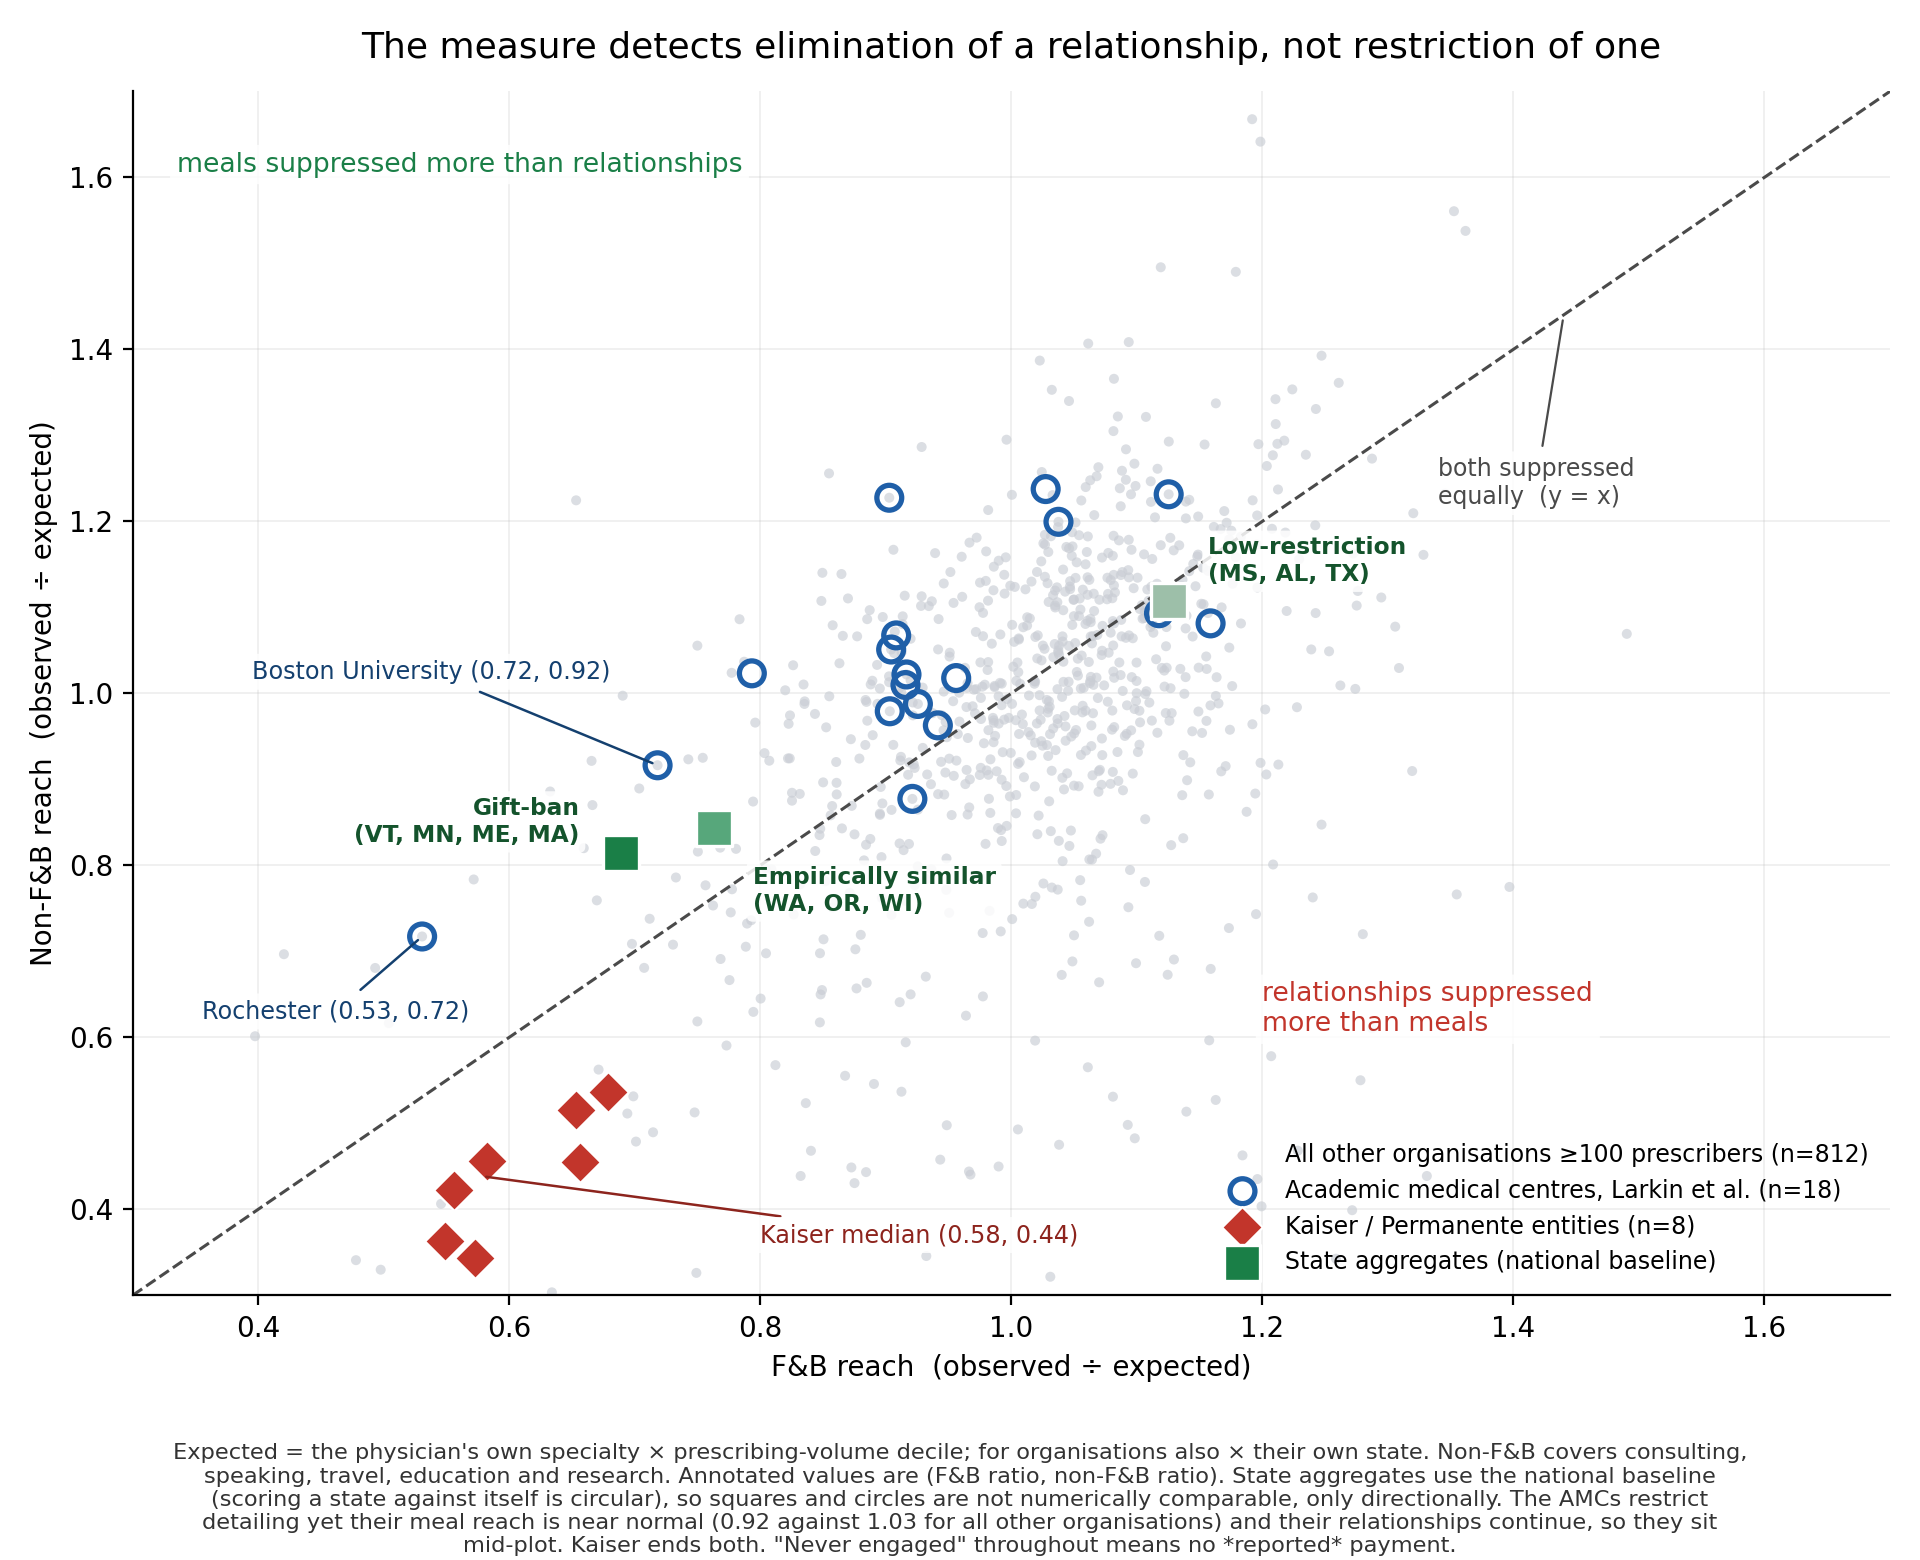
Complete separation. Zero overlap across 26 units. Robust to removing research payments entirely.
The result also corrected my interpretation of it. I expected the AMCs to look like Vermont, with meals suppressed and relationships intact. They don’t. Their food-and-beverage reach is near normal for their own states (median ratio 0.919 against 1.032 for all other organizations). Seventeen of the nineteen had written policies restricting representative access to facilities, and they still look ordinary.
So the measure does not detect policy. It detects whether a commercial relationship survives at all. An academic center restricts the sales call and keeps consulting, speaking, and research. A closed-panel staff-model system ends the relationship.
Which makes the AMCs the control rather than the positive case. Eighteen institutions with documented restrictions looking unremarkable is what establishes that the measure isn’t reading paperwork, academic status, or research intensity.
The clearest single example: Rochester and Boston University suppress meals about as hard as Kaiser does (0.53 and 0.72 against 0.58) and are still correctly separated, because their non-meal reach is 0.72 and 0.92 against Kaiser’s 0.44. One axis would have grouped all three.
The commercial finding is a null
Specialty, state, rurality, practice size, and organization together leave 76.7% of the variance in non-engagement unexplained out of sample.
Non-engagement clusters strongly within organizations, at 26.9 times the variance independence would produce, but 261 organizations holding 15.8% of physicians carry essentially the entire effect. For everyone else, structure predicts nothing.
That sounds like a failed analysis. It is the most commercially relevant result in the project: public data cannot identify which physicians are reachable. Every company selling healthcare-professional engagement is, in effect, selling the thing this analysis could not produce from public files.
What this does not claim
“Never engaged” means “never received a reported transfer of value.” Drug samples are not reportable under the Sunshine Act. A representative can visit a physician, leave samples, and generate no record anywhere. Non-reportable contact is invisible in every jurisdiction, and that is a ceiling on what this analysis can say rather than a footnote to it.
Selection versus treatment is unresolved. Whether never-engaged physicians prescribe generics because industry avoided them, or industry avoided them because they prescribe generics, cannot be determined here. Five program years now make a within-physician design around first engagement feasible. I did not run it.
The two-axis measure is group-level. A single physician with no records cannot be assigned to a mechanism.
No legal classification is applied anywhere. State groupings are empirical. Their overlap with statutory gift-ban regimes is observed, not assumed, and the empirical and legal groupings disagree for at least one state.
Part D is Medicare only, covering roughly two-thirds of Medicare beneficiaries, with no commercial or Medicaid volume.
Method note
The linkage most of this literature treats as unavailable turns out not to be. CMS documentation, an HHS open-data ticket closed as “Not possible,” and several published papers all state that Open Payments does not contain NPIs. That is true of the payment detail files and false of the Covered Recipient Profile Supplement, which carries the identifier fully populated. No entity resolution was required.
The Profile Supplement was verified rather than assumed comprehensive: of 770,465 physicians paid in program year 2021, zero are absent from it. Of 59,213 NPIs appearing anywhere in five years of research payments, two.
Everything runs on public files, with no login, no data use agreement, and no institutional access. Code and full findings, including superseded results and the corrections that produced them, are in the repository.
Analysis is descriptive throughout. Where a model appears, in the out-of-sample variance decomposition, it is split-half with shrunk estimates and reported as such.
Repository: github.com/jvcobl/open-payments-white-space · Full findings documents, figures, and pipeline included.